WATERWORLD
Influence of the temperature on the response time and measuring result of test sets
In chemistry and therefore also in water analysis, the ambi-ent temperature and the preparation of the sample are very important influences, which are decisive for a „cor-rect“ measuring result. A rule of thumb: The speed of a chemical reaction doubles if the temperature rises by 10°C, or: the colder a sample, the slower the response.
If a test cuvette with a sample is „too cold“, the reaction is not completed in the indicated response time. The result will then show minor findings, as the parameter to be measured is still partially present as an original substance in the solution. In order to get the correct result, the test requires a longer response time.
Specifically the cuvette test sets react with different sensi-tivities regarding the test temperature. For example, amo-nium test sets respond especially sensitive to sample preparations that are too cold, like the WTW test A6/25, which is used to clarify the temperature influence.
As you can see in the two graphs, the cold sample takes longer to show the final measuring value; here, it took approx. 3.5 minutes longer. The correct measuring value is reached once the „plateau“ is visible in the graph, as this shows the total substance processing. The extinction value (or measuring value in mg/l) is stable and does not increase any more. Of course, this only applies if you are within the indicated measuring range: if the concentration is higher than the reagent can process, a plateau is reached, but the photometer shows a measuring value transgression.
A color reaction is often only stable for a certain time period; the extinction value decreases because of the deterioration of the color complex for almost all test sets after a certain time. Therefore, it is just as important to capture the measuring values within the indicated time period. The beginning decrease can already be noted in the blue graph.
A check of the plausibility of measuring results can take place by means of a control standard, such as the Combi-Check: A test that is started in parallel to the standard solution will take respectively longer to achieve the „cor-rect“ standard value.
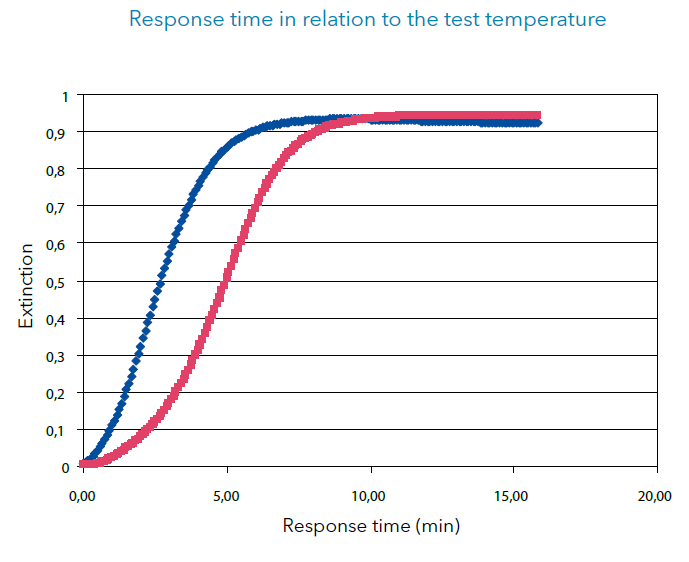
Two test cuvettes are started with a concentration of 4 mg/l each:
- Test 1: Cuvette test with sample at room temperature, approx. 20°C
- Test 2: Cooled cuvette test with sample, approx. 10°C
The development of the color reaction was recorded as kinetics - i. e. substance processing per time unit - with the UV/VIS spectral photometer and evaluated in Excel. The Y axis shows the substance processing, measured as extinc-tion, the X axis shows the response in minutes.
Here you can download the whole article as a PDF: