1/13/2025
| Dr. Markus Hoffmann
Find out here which photometric measurement methods are available.
Introduction to Photometry
Photometric measurement methods have a long history and have been used for over a century. Its roots go back to the 19th century, when the first basic measurement methods were developed. Today, photometry is an integral part of many scientific disciplines, including biology, chemistry, engineering, and pharmacy. It is used in environmental analysis, medical diagnostics and quality control in industry and, along with pH measurement, is one of the most important measurement methods in analytics.
WTW has been active in the field of photometry for over 30 years and has simplified the complex measurement procedure of photometry for decades, e.g. through automatic measurement settings and analytical quality assurance (AQA). For the user, this means convenient and fast measurement.
In addition to classic laboratory analysis, mobile photometric measurement is gaining in importance in environmental monitoring and drinking water monitoring
Of light and colours
From Phos (Greek) for light and metrein (Greek) for measure
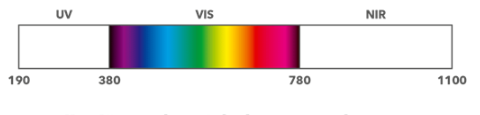
Figure 1: The spectrum can be roughly divided into three ranges: Ultraviolet light (UV) <380nm, visible light approx. 380 – 780nm and infrared light (IR) >780nm.
Photometry is a process in which a solution or dissolved sample is analyzed with the help of a light source. By measuring the light absorption of the sample, the concentration of the substances contained in it is determined. This is possible because light consists of a spectrum of electromagnetic waves that are absorbed by different substances to varying degrees.
Differentiation between photometric and colorimetric analysis
Colorimetry is older than photometry and focuses specifically on measuring colors in solutions. It uses visual color comparisons or digital measurements to determine the concentration of colored substances. Colorimetry typically only works in the visible spectrum.
Photometry, on the other hand, is a method of measuring light intensity that is used to quantify the absorption or transmission of light through a sample. It can use wavelengths across the spectrum, including UV and infrared light.
Measurement Principles
What is measured with the photometer?
Photometry uses three basic types of measurement that build on each other:
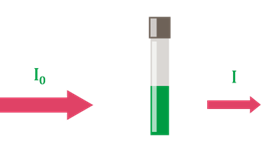
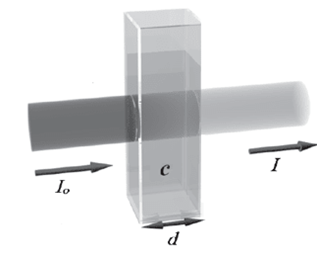
1. Transmission T (%): Measured directly and results from the ratio of light intensity after (I) and before (Io ) of the cuvette. The transmission of a sample changes exponentially with layer thickness and substance concentration. The transmission is also used for turbidity measurement at 180° (FAU unit, e.g. in quality control) and for turbidity correction in concentration measurement.

 Detector
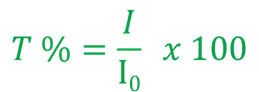
Figure 2: Ratio of light intensity after (I) and before (Io ) the cuvette.
2. Absorbance E: Absorbance or extinction, also known as optical density, is a measure of the attenuation/"extinction" of light by the sample. It is calculated from the logarithm of the transmission: E = - log10 (T). Absorbance in a sample changes in proportion to layer thickness and concentration.
3. Concentration: Derived via extinction or transmission. Quantitative analysis of a substance (mg/l, ppm,...) at a defined wavelength based on a calibration curve.
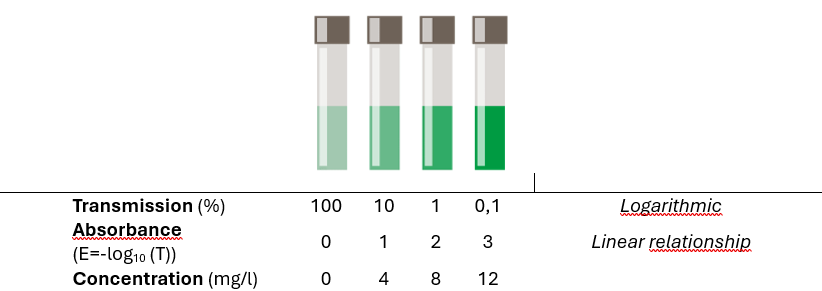
Table 3: Relationship of Transmission/Absorbance to Concentration.
Basics of concentration determination
What are the requirements for a concentration measurement?
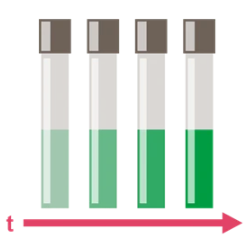
Figure 4: Defined reaction time for colour development.
- The dye is present in dissolved form.
- The color can be detected by an absorbance measurement at a wavelength λ.
- The chemical reaction with the substance leads to the formation or reduction (e.g. COD) of the dye
- The color reaction has a fixed reaction time.
- Color intensity correlates with concentration.
- The reaction must be selective for the substance being sought, and there must be no cross-reactions with other ions.
- The color must be stable for a period of time, e.g. a time window of 10 minutes after the end of the reaction without any change in color (see analysis instructions).
How is concentration derived from extinction?
1. A photometric spectrum is used to determine the specific absorption peak(s) of substances. In this way, the optimal wavelength for concentration measurements can be determined.
2. Several solutions with a known concentration of the substance under investigation are measured at the specified wavelength. The extinction values obtained are entered in the diagram. This results in the calibration curve.
3. Subsequently, the substance concentration of an unknown solution can be derived from the calibration curve on the basis of the absorbance value.
What is concentration measurement based on?
Lambert-Beer's law is the basis for photometric concentration determination:
The dependence of extinction on the concentration of the analyte was found by BEER (1825–1863). Some time earlier, investigations by BOUGUER (1698–1758) and LAMBERT (1728–1777) showed that extinction depends on the layer thickness of the cuvette. The combination of both laws led to Lambert-Beer's law, which can be described by the following relationship:
E = ελ· c · d
ελ = molarer Extinktionskoeffizient l/(mol*cm) bei Wellenlänge λ
d = Schichtdicke der Küvette in cm
c = Analyt-Konzentration in mol/l
Photometers
Photometry and photometers have continued to evolve over the past few decades. In the meantime, large parts of the measurements are carried out automatically. Rapid cuvette tests , as well as pre-programmed measurement methods and automatic cuvette detection, have accelerated the process of photometric analysis, increased accuracy and reduced the error rate.
Light Sources and Optics
Certain wavelengths are created by:
1. Special light sources for the UV and VIS range:
• LEDs: low power consumption, low light intensity, wavelength-specific
• Tungsten halogen lamps: white light, for VIS range, often combined with
• Deuterium special lamps: UV range, very expensive
• Xenon flash lamps: UV-VIS range, long service life
2. Different optics and filter structures:
• Mono or polychromators
• Filter Optics
• LED Filter Combination
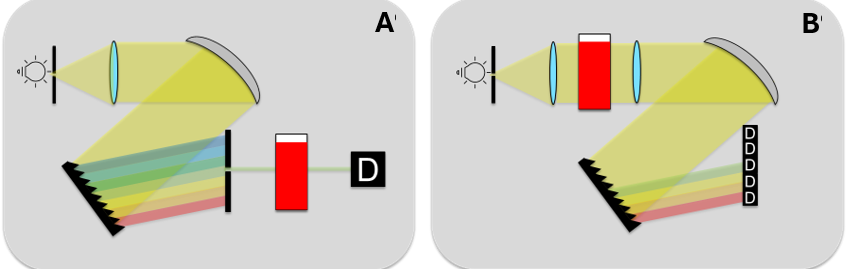
Figure 5: Set up mono- (A) and polychromator (B).
Monochromators are among the most common optical elements in photometers. It is used to isolate a certain wavelength from an incident, broadband beam of light. The function is based on several steps:
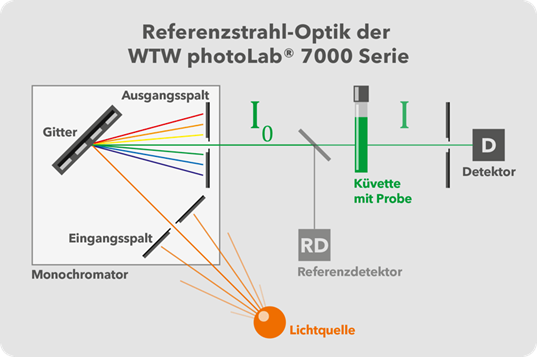
Figure 6: photoLab® 7000 Series Monochromator with Reference Beam for Higher Accuracy.
- Input slit: The light enters through an input slit, where it is initially bundled to produce parallel rays of light.
- Dispersing element: The parallel light is then directed to a dispersing (light-scattering) element, such as a prism or an optical grating. These elements break up light into its different wavelengths.
- Exit slit: After dispersion, the light is passed through an exit slit that only allows the desired wavelength to pass through. By adjusting the angle of the dispersing element, the user can select the specific wavelength needed for the measurement.
To the photometers
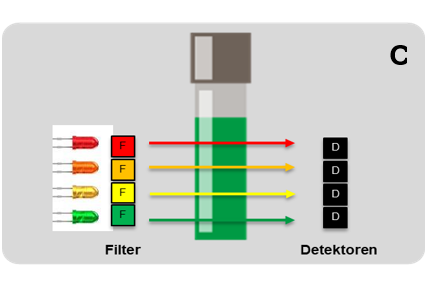
Figure 7: LED + optical filter, e.g. pHotoFlex® series.
LED filter photometers are also widely used, but they are much simpler in their design and limited in their applications because only a limited number of wavelengths are available. An LED (light-emitting diode) produces light in a specific wavelength that is optimal for the substance to be measured. Additionally, an optical filter is used to limit the light to the desired wavelength. The filtered light is passed through the sample. A photodetector measures the intensity of the light that has passed through the sample.
Methods and measurements
How does a photometer automatically determine the concentration of substances?
In order for a photometer to automatically output a concentration value, the system needs a few more data in addition to the calibration curve. Stored data for a simple and accurate photometric measurement consists of:
- Optimal wavelength for measurement
- Reagent blank value E0 = color of the reagent
- Slope factor
- Citation form and unit (z.B. NO3-N mg/l)
- Conversion factors for changing citation form and unit (e.g. NO3; mmol/l)
The sample blank value (e.g. colored samples) is not included! and must be measured manually in the event of colored samples.
Due to the reagent color (reagent blank value) and the sample color (sample blank value), the zero point of the calibration curve shifts along the absorbance axis.
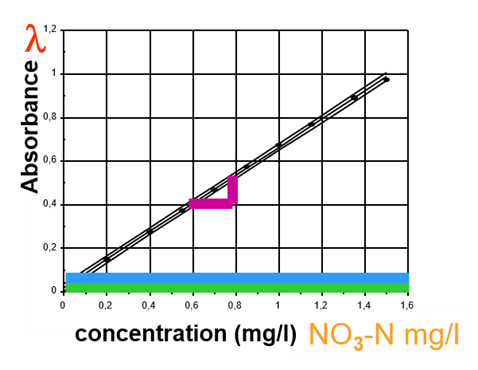
Figure 8: Calibration curve for automatic concentration determination.
Frequently questions and answers
Test Selection
Which test set can be used to get the most accurate measured values?
The actual measurement range of the tests depends on the devices, the reaction has detection limits. Measurement range values in photometry are between -2 E (±0.5) and + 2 E (±0.5) at extinction values.
At the lower end of the measuring range, detection limit and tolerance have the greatest effect: process characteristics such as confidence range and accuracy are often identical to the lower end of the measuring range. Scratches, pipette errors and other handling errors further reduce the accuracy of the measurement results and lead to higher inaccuracy!
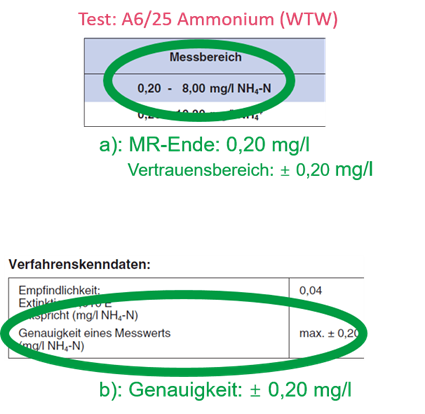
Figure 9: Confidence Range and Accuracy in an Ammonium Cuvette Test.
The greatest possible accuracy is obtained by measuring in the middle of the measuring range!
- The test sets should therefore be selected according to the expected values.
- For initial determinations, tests with the largest possible measuring range are suitable.
Null values and device drift
Why and when does a zero measurement have to be carried out?
The measurement properties of photometers can change over time or due to external influences (e.g. temperature, humidity). This change is called drift. The zeroing (see manual - German version) can compensate for the drift.
Portable devices often require zeroing due to transport and changing environmental conditions.
are mostly used under constant laboratory conditions. Devices with a reference beam are also very stable and show little drift. Therefore, zeroing is less often necessary. For complex measurements, such as spectra, a zeroing/baseline is usually standard.
Test instructions sometimes show the sensitivity with the correlation extinction (E) to mg/l. The effect of a drift can be read directly:
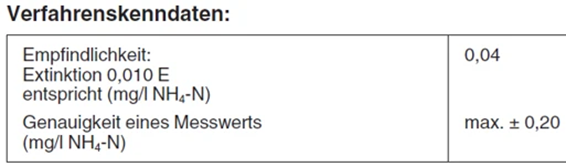
Example ammonium test: 10 mE drift without zeroing means 0.04 mg/l – i.e. 10% avoidable false findings – at the lower measurement range!
Spectrophotometers in routine analysis
Digitally and mobile photometric measurement on the go?
No problem - our experts explain to you which two essential factors are important. Learn more about the suitability or the correct handling of the devices and sensors as well as the reagents.
Photometry tips for practice
On 40 pages, you will find in the practical manual for photometry, in addition to many other tips and experience values of our experts for practice, for example, the 10 most important questions and answers about plausible measured values in photometry.
Download now free of charge!
High-precision photometers
An overview of the high-precision photometers from WTW, a brand of Xylem Analytics Germany - universal, digital and portable spectrophotometers, high-precision robust filter photometers and the versatile portable photometers with multiparameter function for turbidity, pH and redox available - can be found here!